Visualize any knowledge graph.
In 3D.
Interactive 3D graph visualization with memory monitoring, pathway-aware layouts, volumetric clustering, molecule viewer, and analytics. Built with Three.js — zero dependencies.
> /plugin install neural-graph-visualizer
Requires Node.js 18+ and a WebGL-capable browser
Not just a graph. A reasoning tool.
Topology-driven layouts that reveal structure. Molecule viewers that show what the nodes actually are. Analytics that surface what matters.
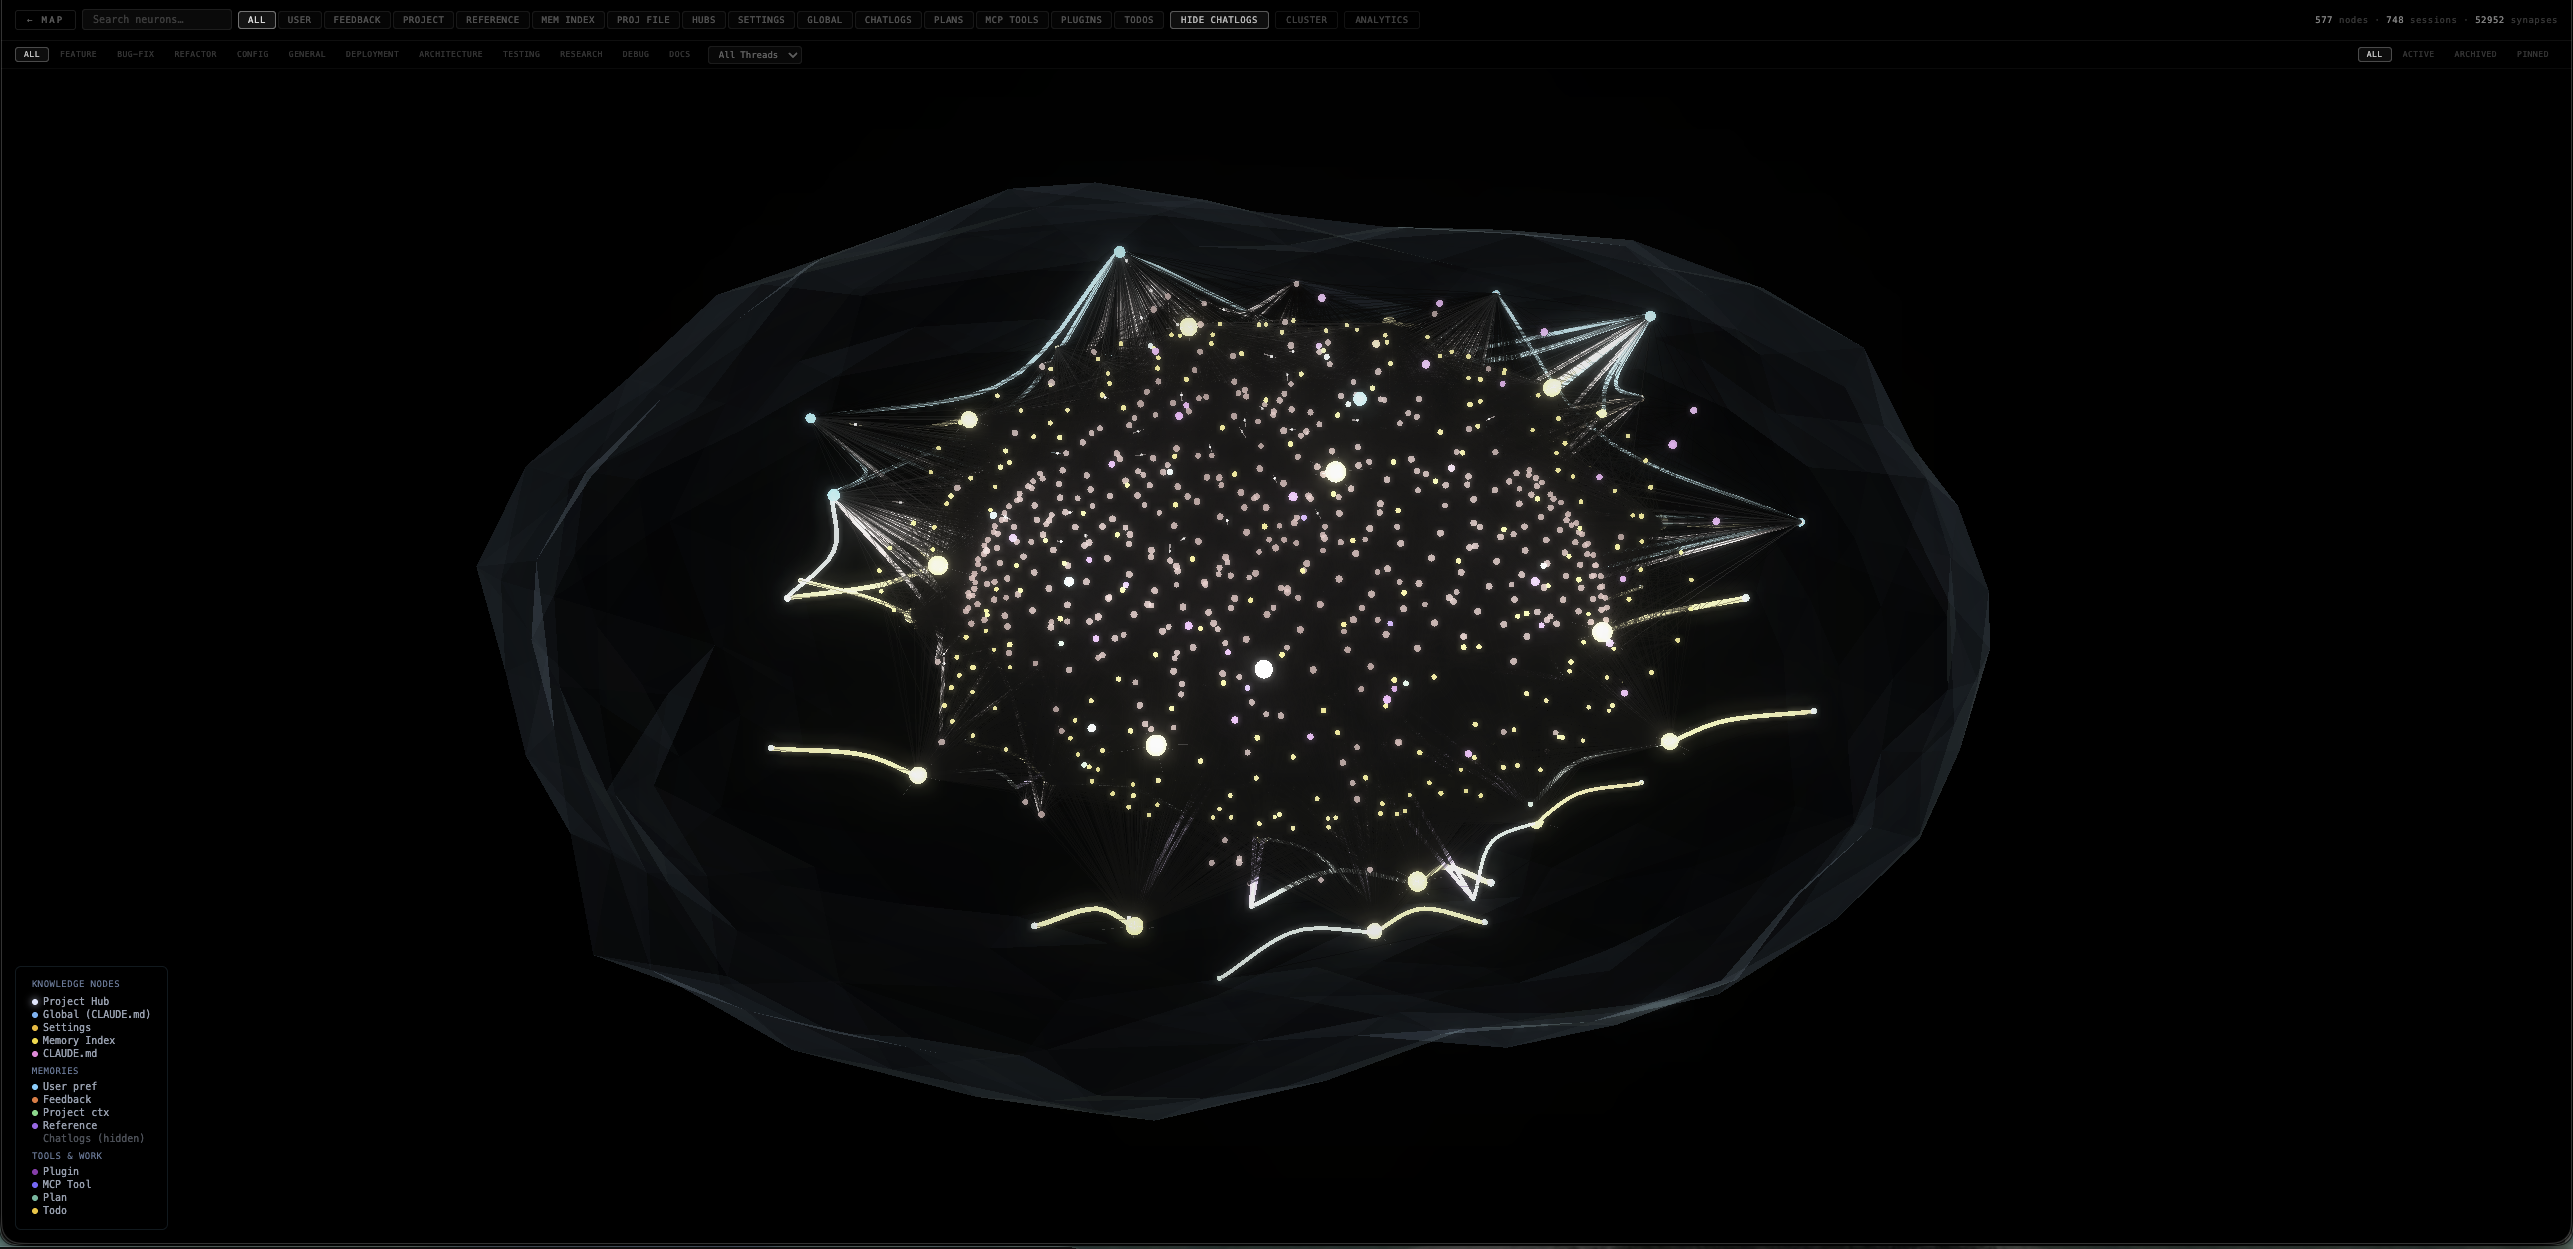
Memory Monitor
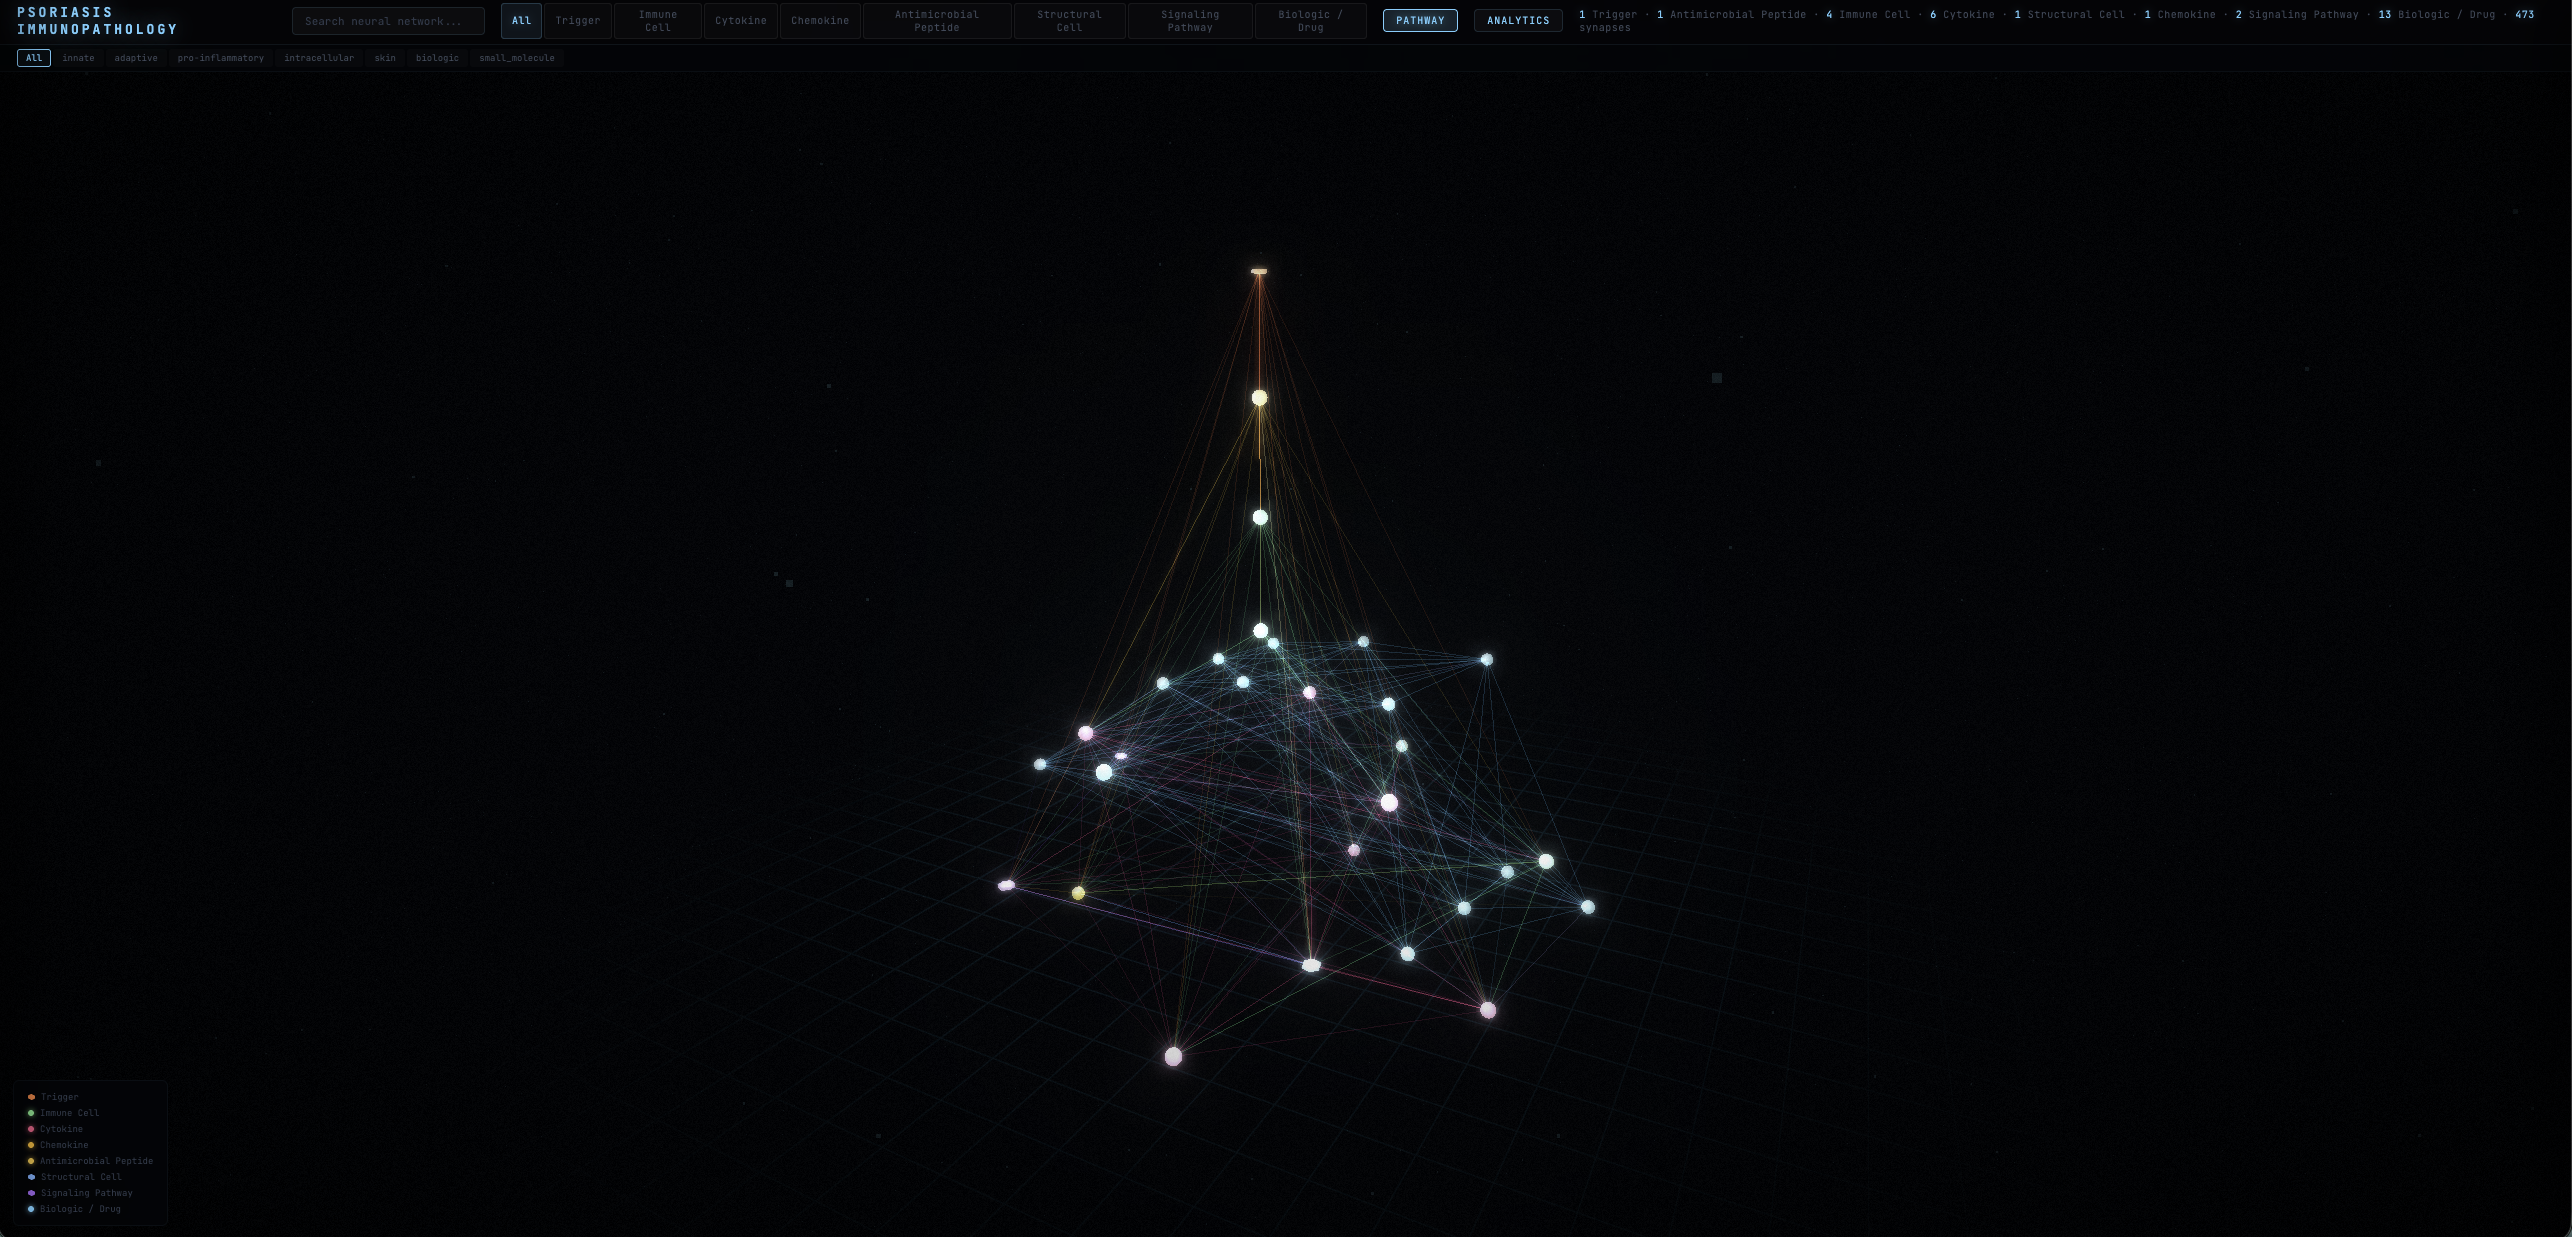
Visualize Claude Code’s entire memory system — knowledge nodes, user preferences, feedback, project context, chatlogs, plugins, and tools as a live 3D neural map with volumetric mesh envelope.
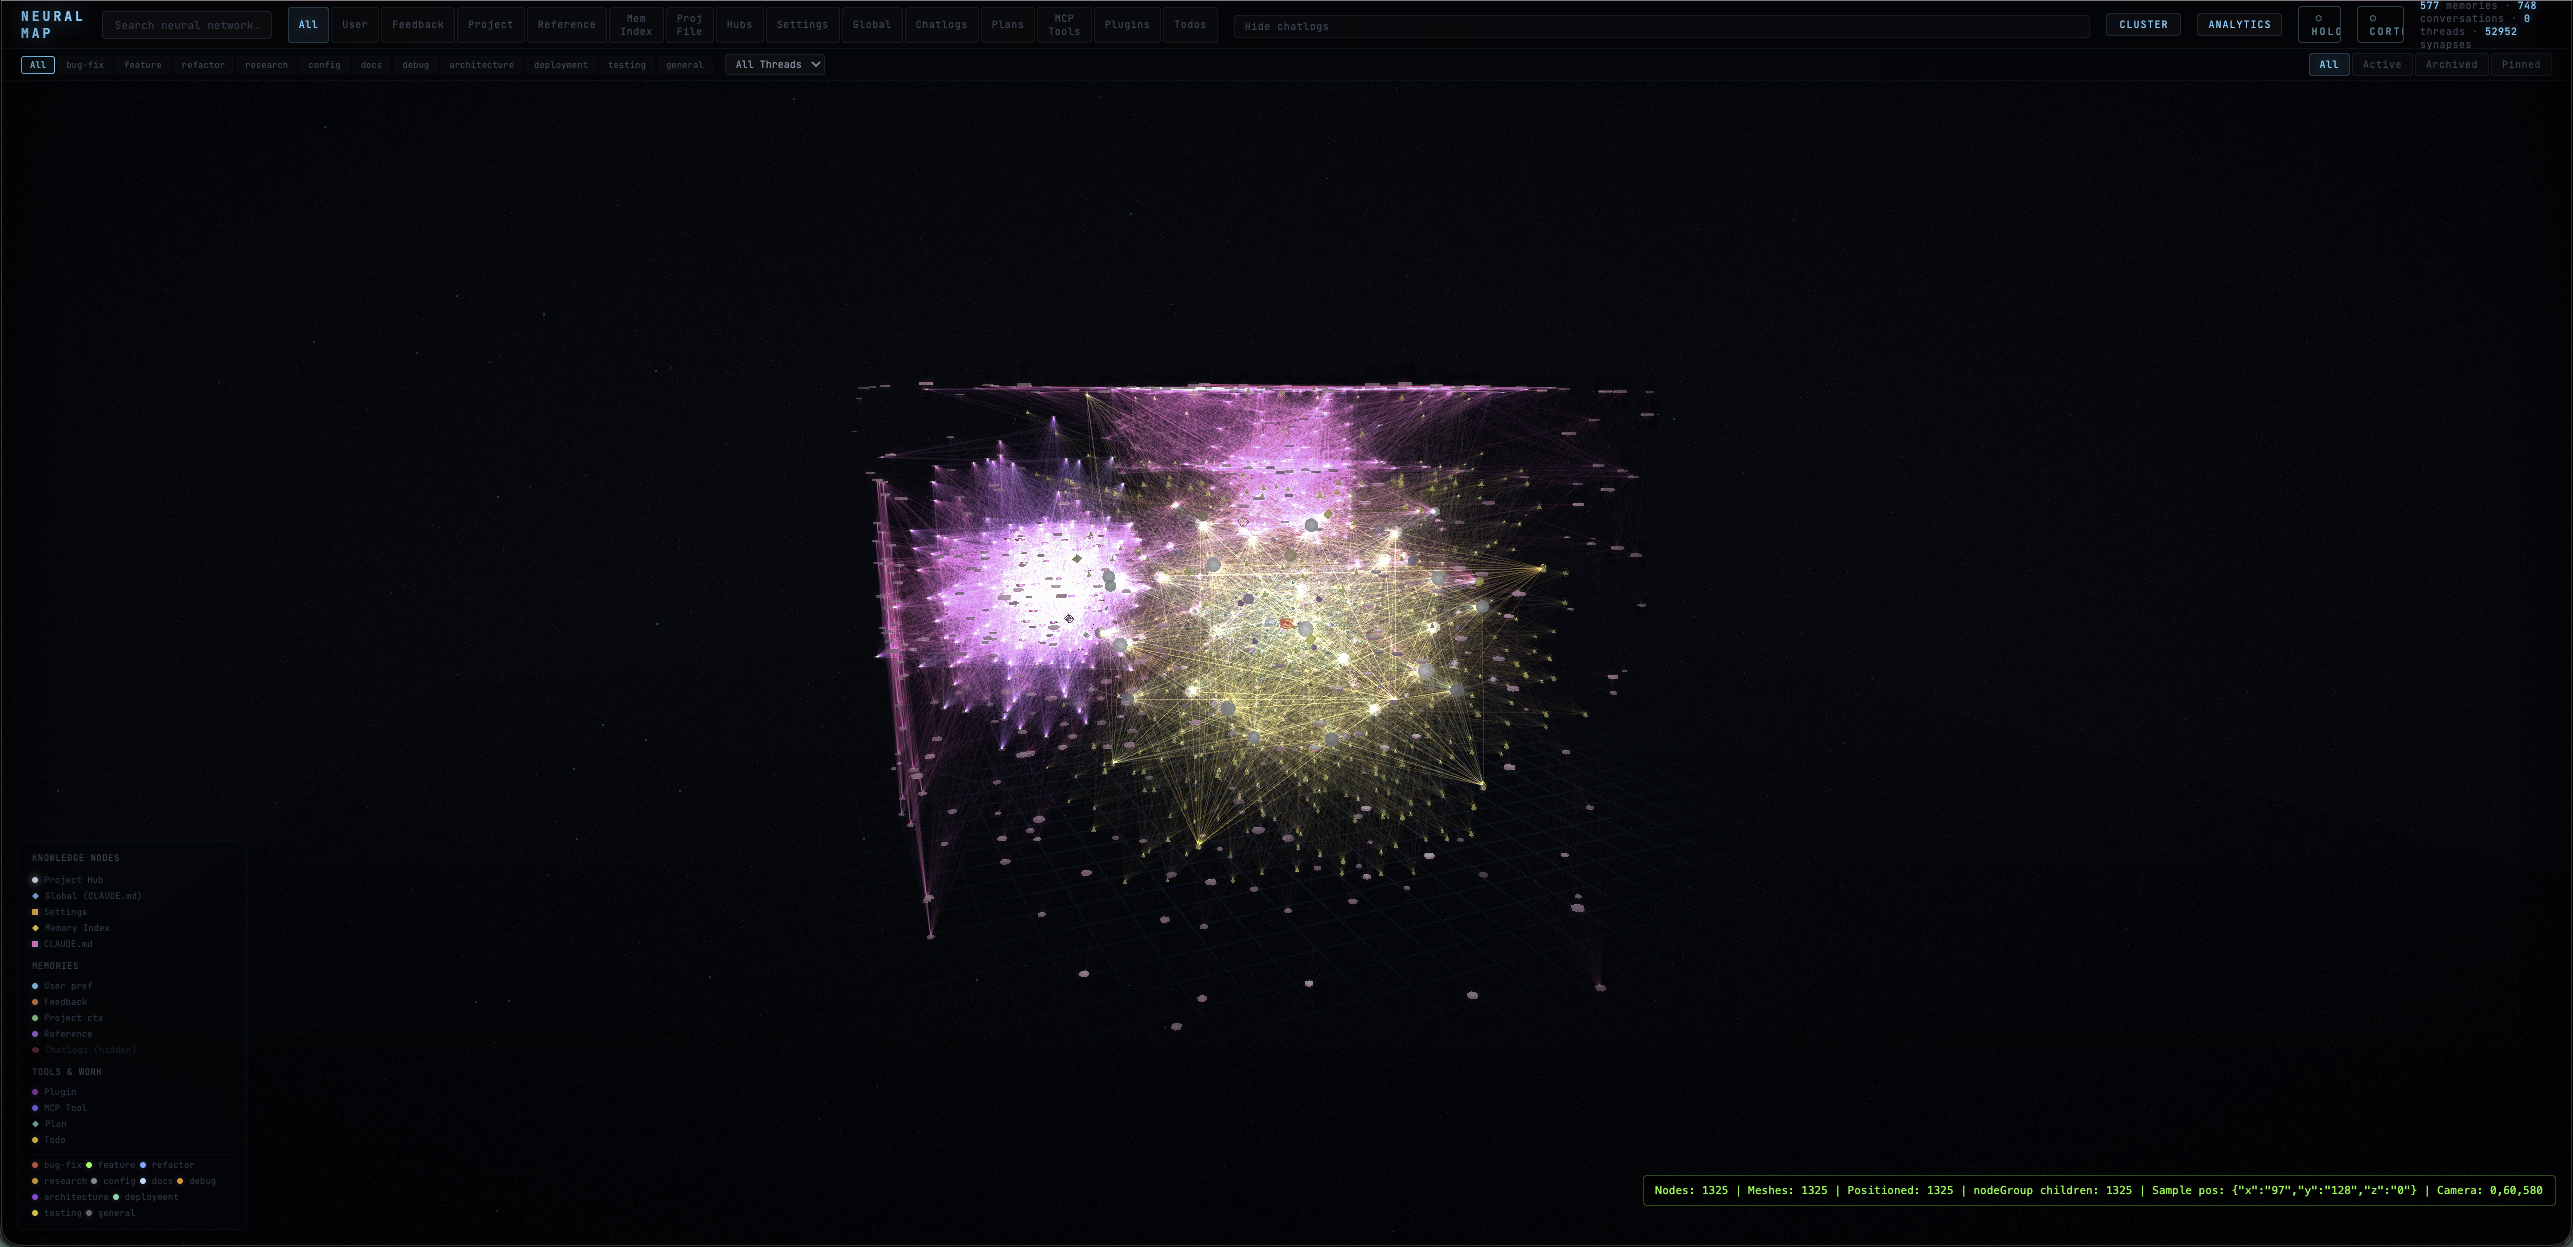
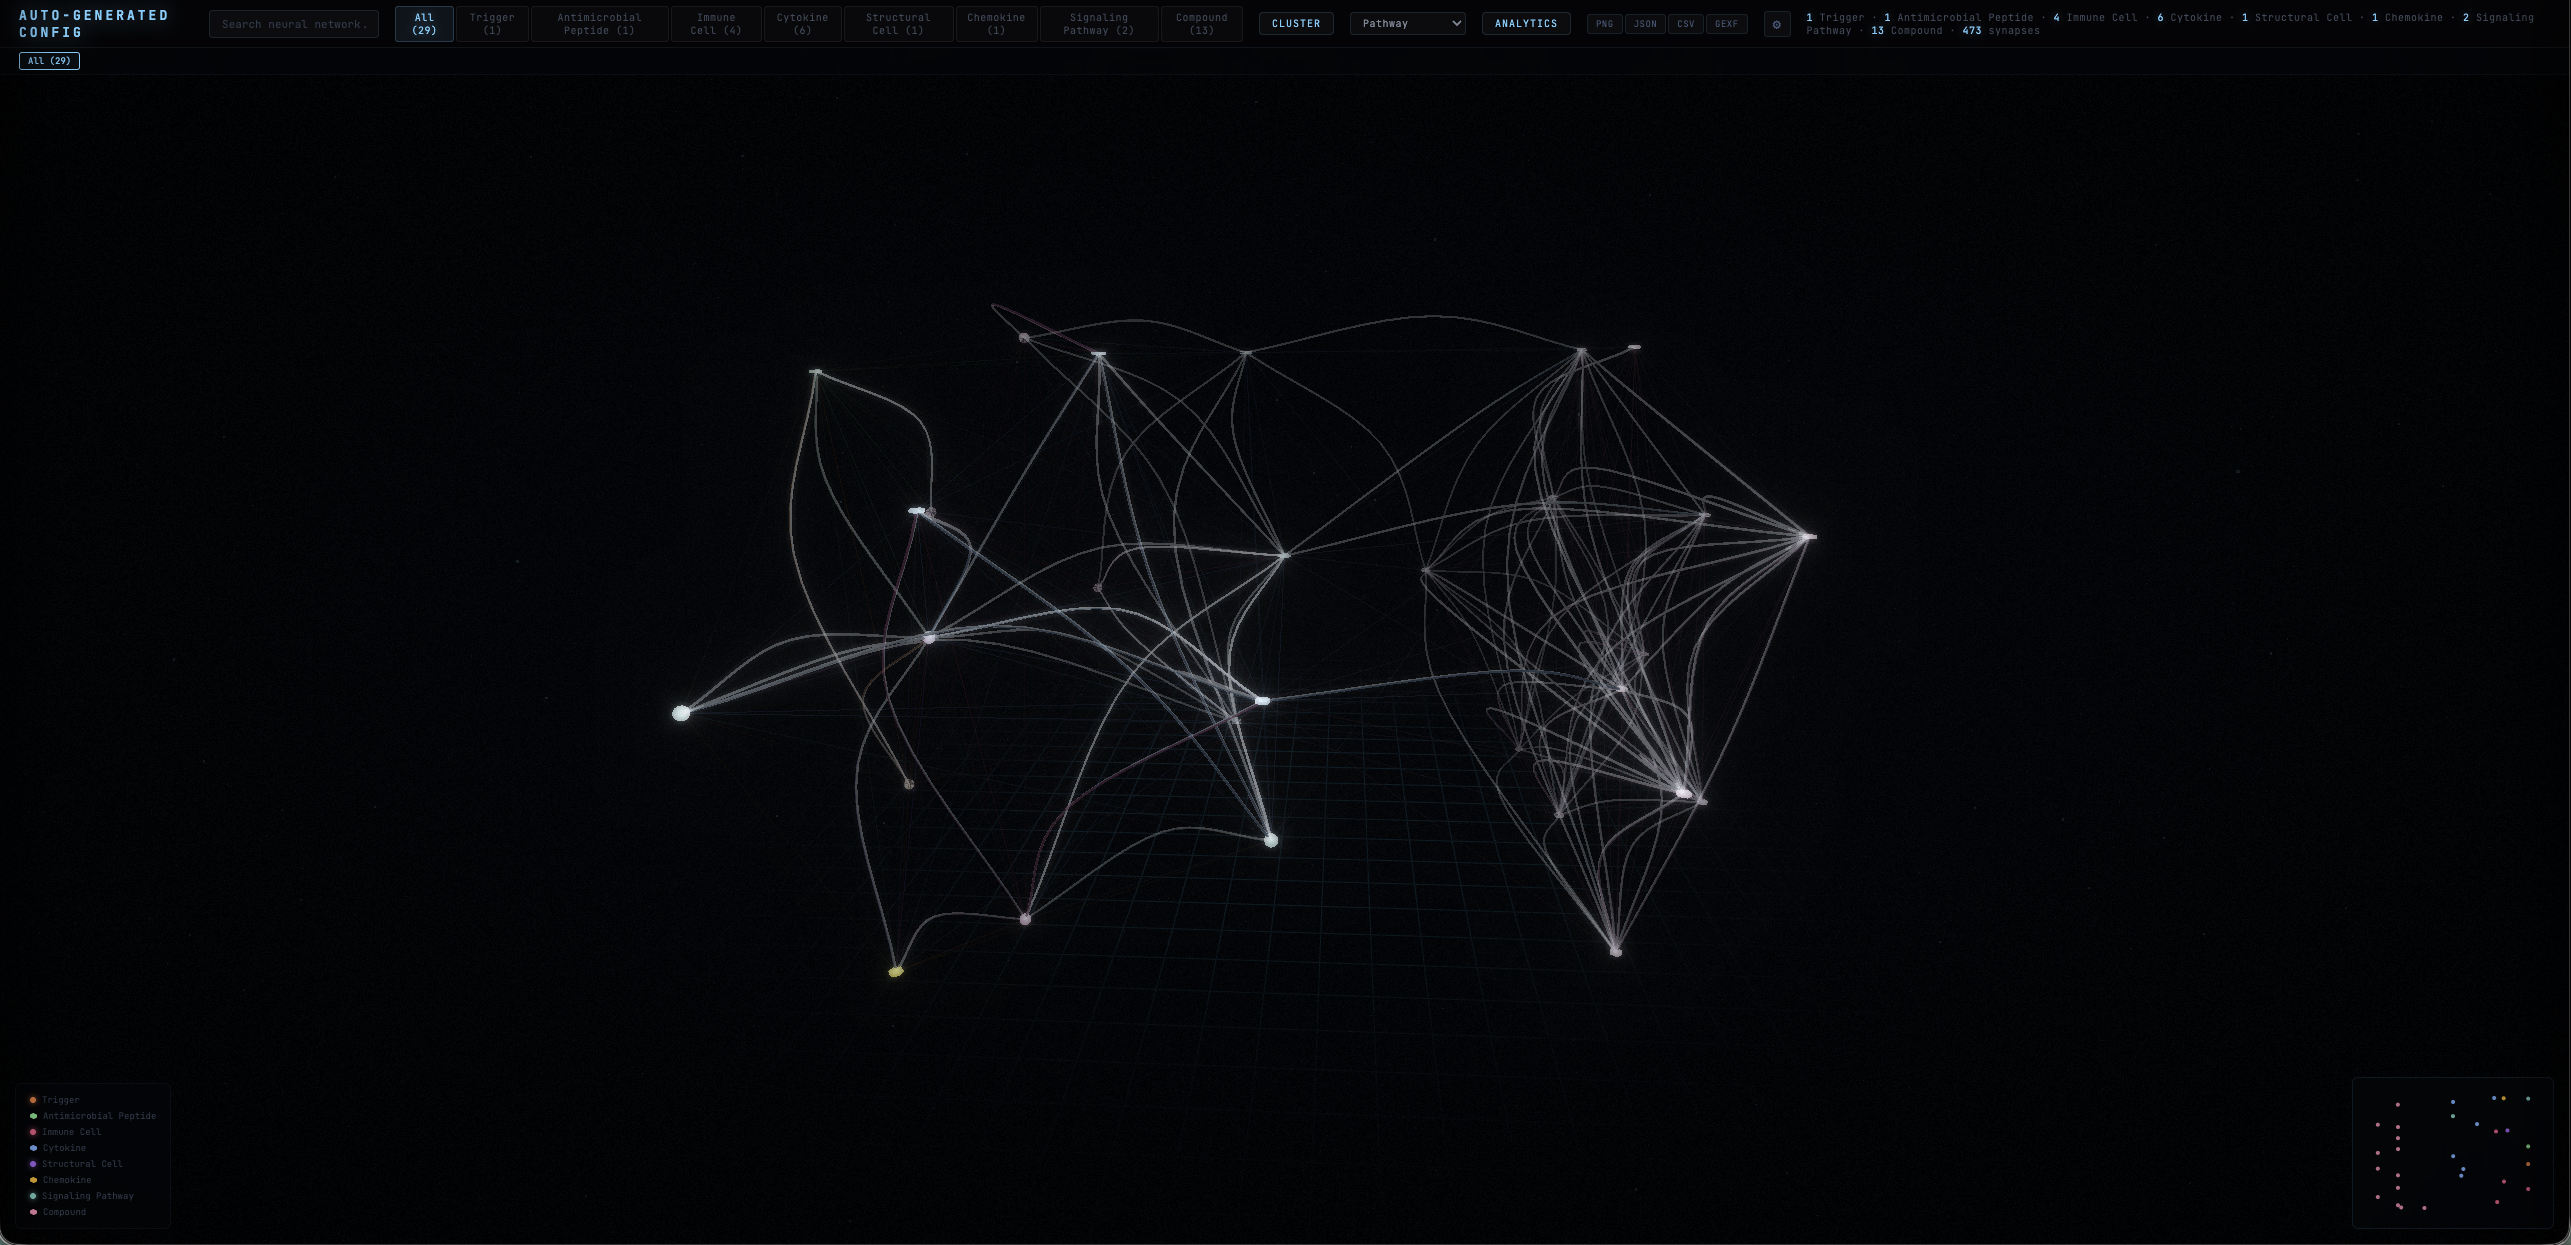
Cluster Layout
1,325+ nodes rendered in volumetric 3D with category filtering, thread grouping, and real-time debug overlay. Nodes grouped by type with mesh envelopes showing cluster boundaries.
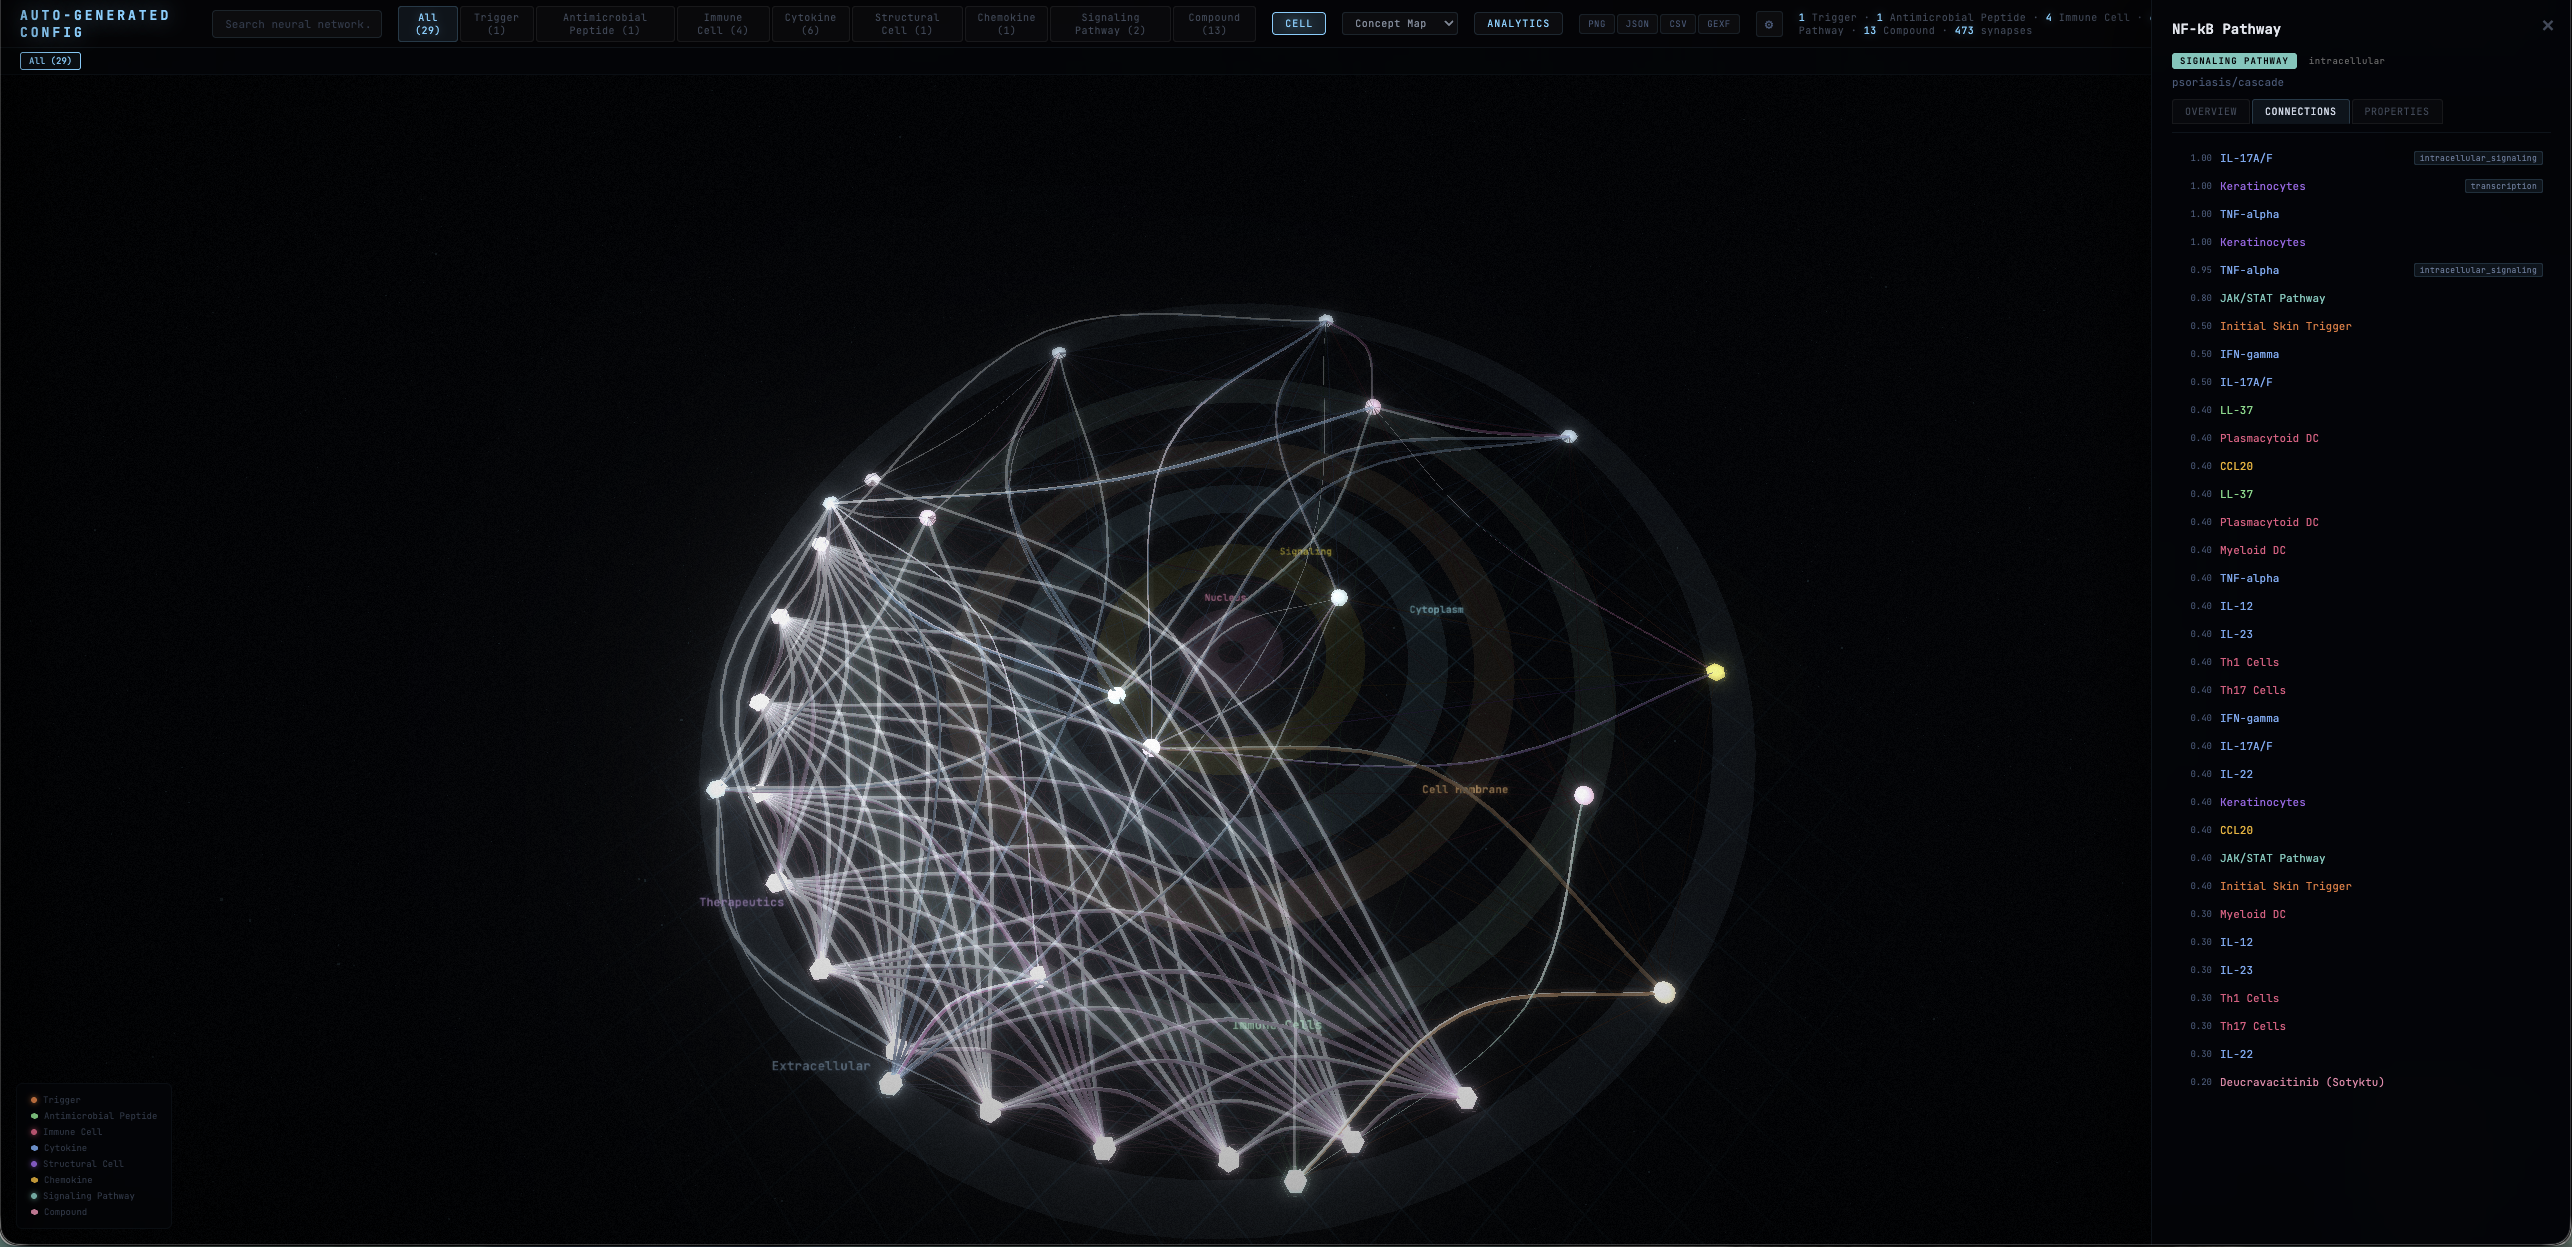
Pathway-Aware Layouts
Six strategies — cascade, pipeline, radial, force, cluster, and auto — computed from directed edge types and hierarchical ranks. Topology, not just physics.
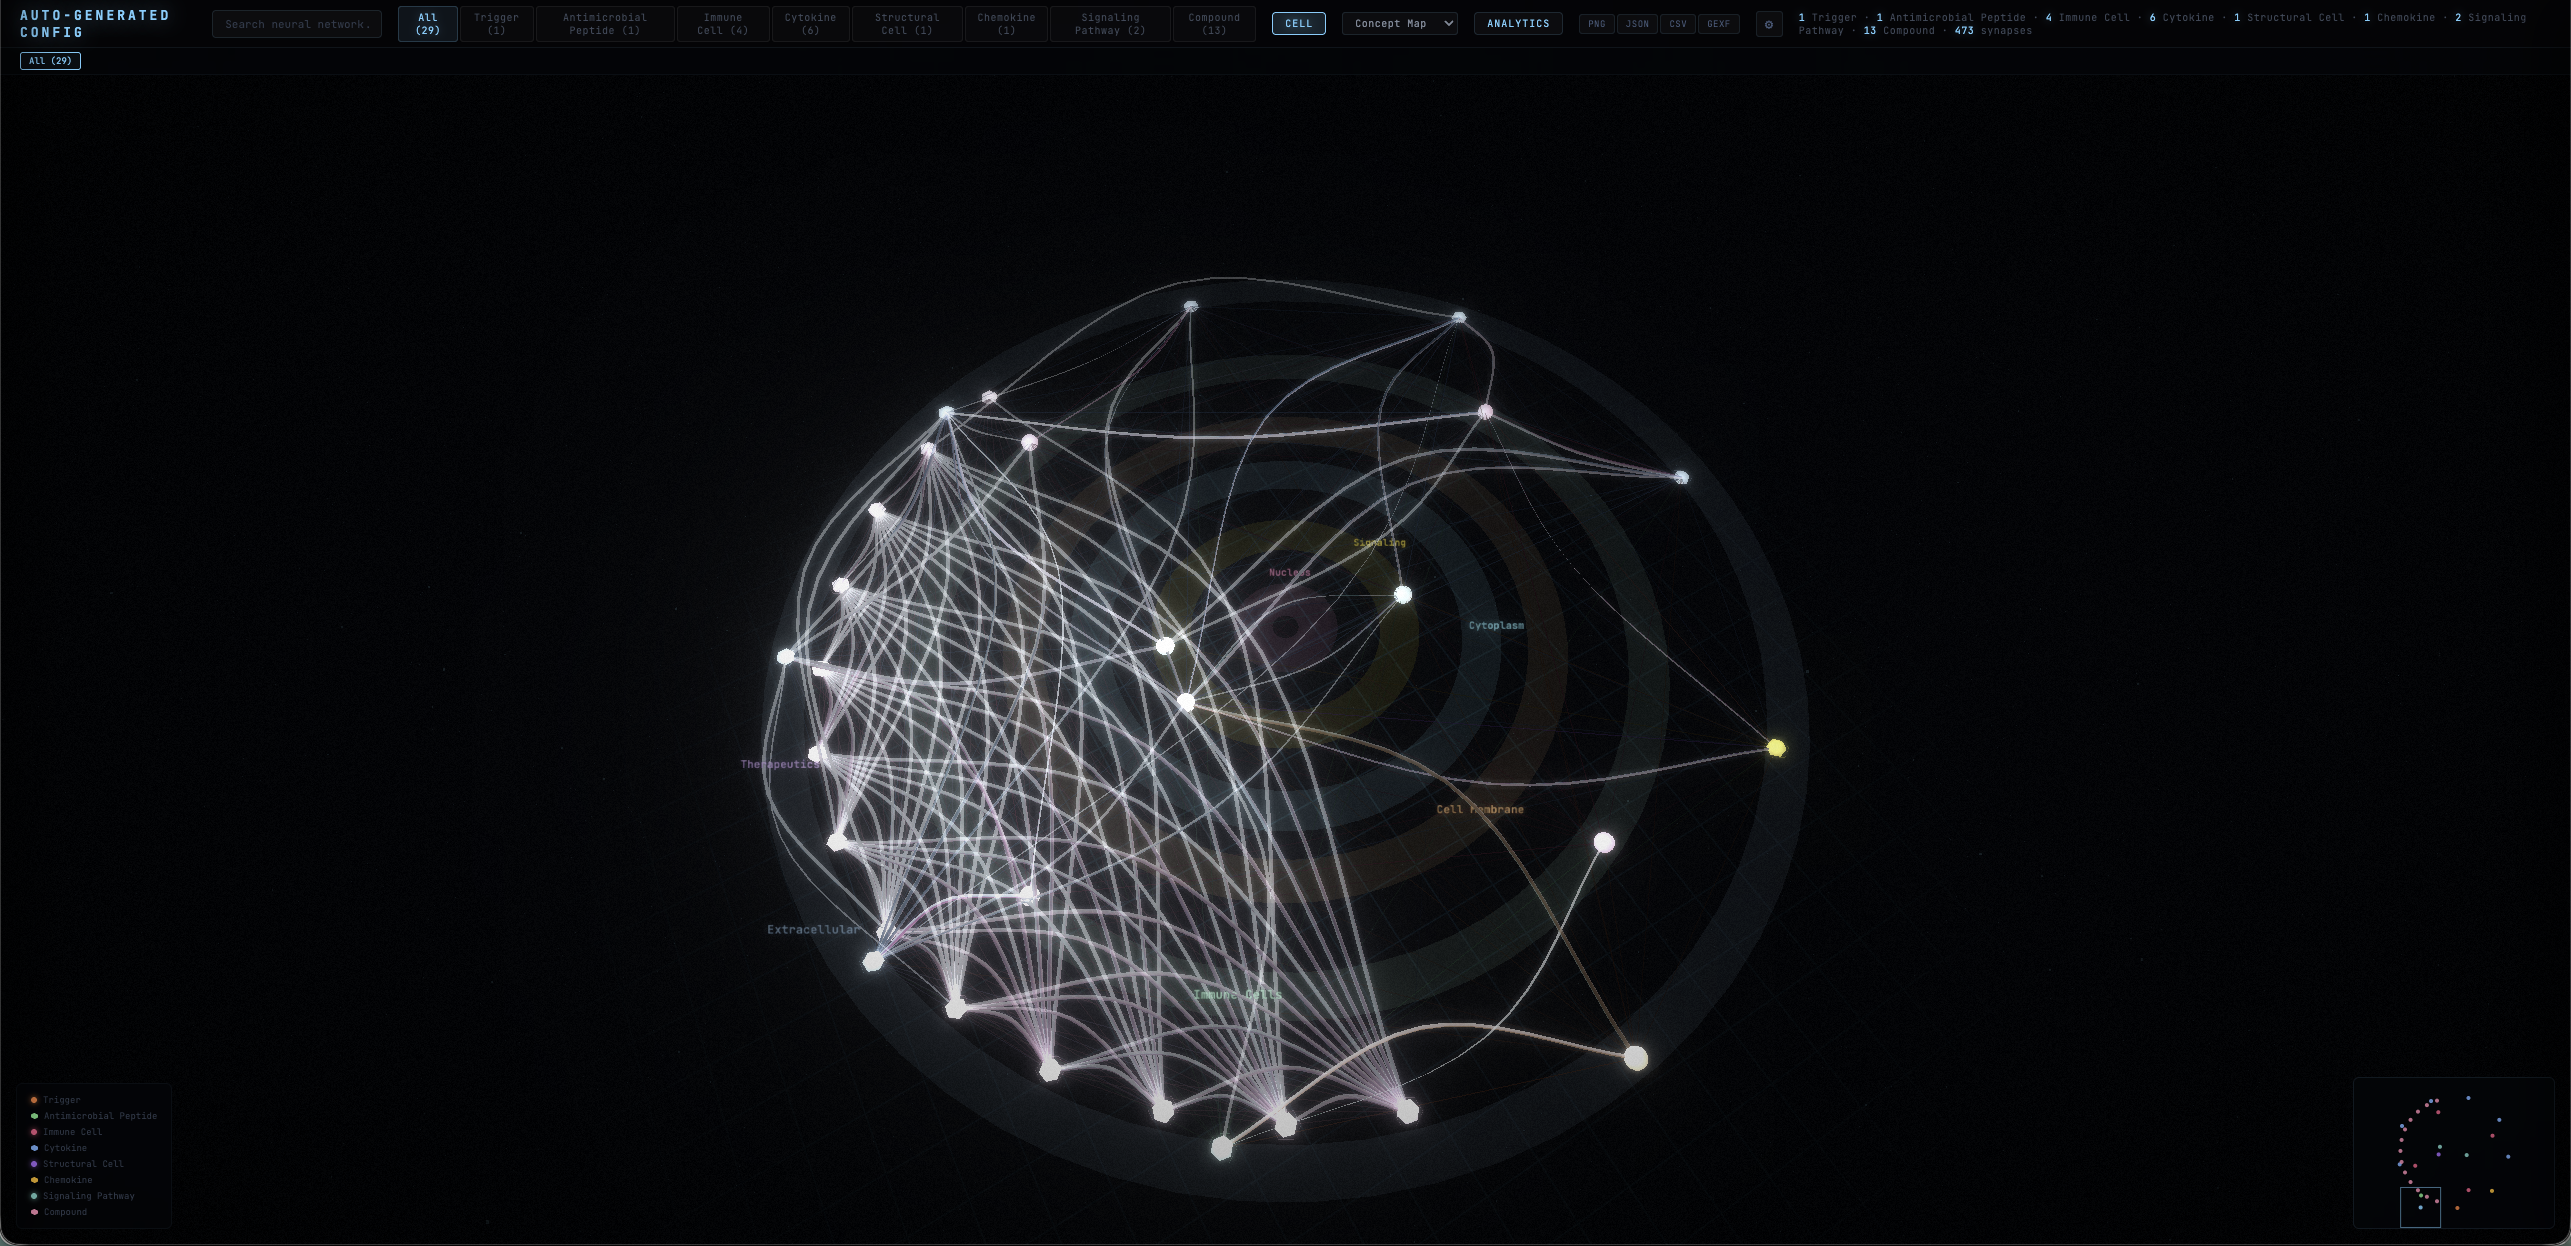
Molecule Viewer
Nodes with PDB IDs get a 3D protein viewer (ribbon, ball-and-stick, surface). SMILES rendering for small molecules. Built for biotech and pharma research graphs.
MCP Integration
12 tools for Claude Code — open visualization, search nodes, import JSON/CSV, manage threads, add cross-references, query the brain index. Full programmatic access.
Research Templates
Drug discovery, immunopathology, blank starter. Copy a template, edit the JSON, launch. Industry presets for healthcare, pharma, food safety — or bring your own data.
Six layout strategies. Auto-detected.
The layout engine classifies your edges and picks the best strategy. Or you choose.
| Strategy | Axis | Best For | Auto-Detected When |
|---|---|---|---|
| Cascade | Y (top → bottom) | Signaling pathways, dependency chains | >40% flow-type edges |
| Pipeline | X (left → right) | Sequential stages, workflows | Contains proceeds_to edges |
| Radial | Center → out | Target-centric views, interaction networks | Manual selection |
| Cluster | Volumetric 3D | Memory maps, large datasets, category grouping | Memory monitor mode |
| Force | Physics-based | Generic graphs, exploration | Default fallback |
| Auto | Detected | Any — picks from edge distribution | Default when omitted |
12 MCP tools. Full programmatic access.
Control the graph from Claude Code. Import data, search, add cross-references, manage threads — all via natural language.
# or ask Claude naturally:
> "Open the neural graph visualization"
> "Import my research data from data.json"
One JSON file. Three sections.
Config, nodes, edges. Define node types with colors and shapes, then describe your graph.
Config & Nodes
"_config": {
  "name": "My Graph",
  "nodeTypes": {
    "concept":  { "color": "#45aaf2", "shape": "sphere" },
    "entity":   { "color": "#26de81", "shape": "hex" }
  },
  "_layout": { "strategy": "auto" }
},
"nodes": [{
  "id": "node_1",
  "name": "My Node",
  "type": "concept",
  "pdbId": "5DK3"
}]
Edges & Edge Types
"edges": [{
  "source": "node_1",
  "target": "node_2",
  "weight": 0.8,
  "edgeType": "activation"
}]

// Flow edges (drive layout):
// activation, production,
// differentiation, proceeds_to,
// validates, causes

// Inhibition edges (flank targets):
// inhibition

// Proximity edges (no layout effect):
// binding, expression, synergy,
// relates_to, participates_in
Built for research. Works for anything.
Any directed graph with typed nodes and edges. Drop in your JSON and go.
AI Pipeline Runs
Visualize every stage, artifact, and agent decision from your autonomous pipeline as a live neural graph.
Drug Discovery
Map targets, compounds, pathways, and clinical endpoints. PDB protein viewer and SMILES rendering built in.
Food Safety Networks
Trace contamination pathways, regulatory dependencies, and supply chain relationships across facilities.
Any Knowledge Graph
Codebase architecture, org charts, research citation networks, threat models. If it has nodes and edges, it renders.
Get started in 2 commands
Install as a Claude Code plugin or run standalone from CLI.
Claude Code Plugin
> /plugin marketplace add cdeust/neural-graph-visualizer
> /plugin install neural-graph-visualizer
# Launch:
> /neural-graph
Standalone CLI
$ cd neural-graph-visualizer
$ ./scripts/setup.sh
# Launch with your data:
$ node scripts/launch.js your-data.json
Free & Open Source
MIT licensed. Clone it, fork it, ship it. Zero dependencies, zero vendor lock-in.